
Edelweiss Flexi Cap Fund
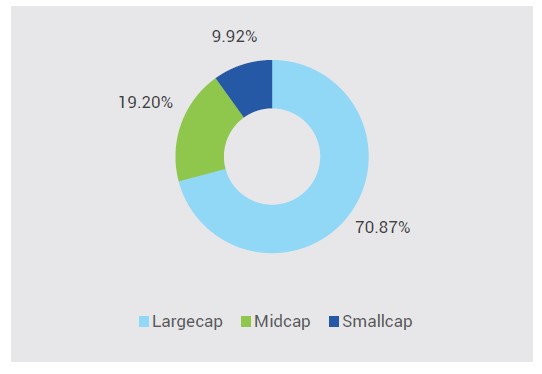
An open ended dynamic equity scheme investing across large cap, mid cap, small cap stocks
Data as on 31st January, 2025
| Investment Objective : The investment objective of the Scheme is to generate long-term capital appreciation from a diversified portfolio that dynamically invests in equity and equity-related securities of companies across various market capitalisation. However, there can be no assurance that the investment objective of the Scheme will be realized. |
|
| Inception Date | 3-Feb-15 |
| Benchmark | Nifty 500 TR Index |
| Fund Managers Details | Mr. Trideep Bhattacharya. Experience 25 years Managing Since 01-Oct-21
|
| Minimum Investment Amount | Rs. 100/- per application & in multiples of Re. 1/- thereafter |
| Additional investment amount | Rs. 100/- per application & in multiples of Re. 1/- thereafter |
| Exit Load |
|
| Total Expense Ratios~: | Regular Plan 1.96% Direct Plan 0.43% |
| Month End AUM |
Rs. 2,376.91 Crore
|
| Monthly Average AUM |
Rs. 2,399.62 Crore
|
| Regular Plan Growth Option |
35.5950 |
| Regular Plan IDCW Option |
29.2270
|
| Direct Plan Growth Option | 40.8870 |
| Direct Plan IDCW Option |
33.5690
|
| (as on January 31, 2025) |
|
Name of Instrument
|
Industry
|
% to Net
Assets
|
| Equities | 96.32% | |
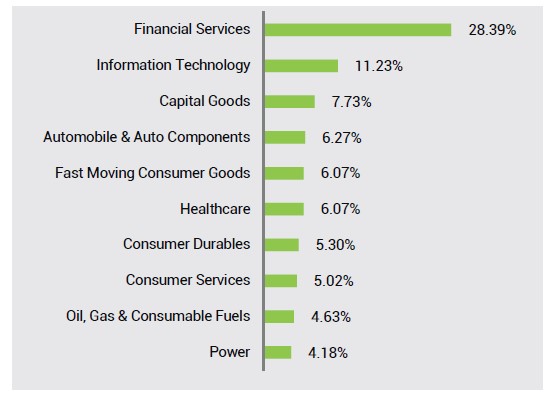
| HDFC Bank Ltd. | Financial Services | 7.33% |
| ICICI Bank Ltd. | Financial Services | 5.50% |
| Infosys Ltd. | Information Technology | 4.83% |
| Larsen & Toubro Ltd. | Construction | 4.18% |
| Reliance Industries Ltd. | Oil, Gas & Consumable Fuels | 2.69% |
| Mahindra & Mahindra Ltd. | Automobile & Auto Components | 2.58% |
| Ultratech Cement Ltd. | Construction Materials | 2.56% |
| Bharti Airtel Ltd. | Telecommunication | 2.35% |
| NTPC Ltd. | Power | 2.04% |
| Dixon Technologies (India) Ltd. | Consumer Durables | 2.03% |
| Bajaj Finance Ltd. | Financial Services | 1.92% |
| State Bank of India | Financial Services | 1.88% |
| Sun Pharmaceutical Industries Ltd. | Healthcare | 1.72% |
| Persistent Systems Ltd. | Information Technology | 1.61% |
| Godrej Properties Ltd. | Realty | 1.58% |
| HCL Technologies Ltd. | Information Technology | 1.52% |
| Trent Ltd. | Consumer Services | 1.52% |
| Titan Company Ltd. | Consumer Durables | 1.46% |
| Coforge Ltd. | Information Technology | 1.43% |
| PB Fintech Ltd. | Financial Services | 1.35% |
| Axis Bank Ltd. | Financial Services | 1.29% |
| Bharat Electronics Ltd. | Capital Goods | 1.27% |
| Hindustan Unilever Ltd. | Fast Moving Consumer Goods | 1.25% |
| Multi Commodity Exchange Of India Ltd. | Financial Services | 1.15% |
| Shriram Finance Ltd. | Financial Services | 1.14% |
| Sundaram Finance Ltd. | Financial Services | 1.09% |
| Marico Ltd. | Fast Moving Consumer Goods | 1.09% |
| Havells India Ltd. | Consumer Durables | 1.09% |
| Radico Khaitan Ltd. | Fast Moving Consumer Goods | 1.07% |
| Info Edge (India) Ltd. | Consumer Services | 1.05% |
| Muthoot Finance Ltd. | Financial Services | 1.02% |
| Tata Consultancy Services Ltd. | Information Technology | 1.01% |
| IPCA Laboratories Ltd. | Healthcare | 1.01% |
| Lupin Ltd. | Healthcare | 1.01% |
| Bikaji Foods International Ltd. | Fast Moving Consumer Goods | 0.99% |
| JSW Energy Ltd. | Power | 0.95% |
| Bajaj Housing Finance Ltd. | Financial Services | 0.95% |
| Oil India Ltd. | Oil, Gas & Consumable Fuels | 0.95% |
| KEI Industries Ltd. | Capital Goods | 0.94% |
| TVS Motor Company Ltd. | Automobile & Auto Components | 0.93% |
| Cholamandalam Investment & Fin Co Ltd. | Financial Services | 0.91% |
| Home First Finance Company India Ltd. | Financial Services | 0.90% |
| CG Power and Industrial Solutions Ltd. | Capital Goods | 0.88% |
| Tata Motors Ltd. | Automobile & Auto Components | 0.86% |
| Alembic Pharmaceuticals Ltd. | Healthcare | 0.76% |
| Bharat Dynamics Ltd. | Capital Goods | 0.75% |
| Power Finance Corporation Ltd. | Financial Services | 0.74% |
| Titagarh Rail Systems Ltd. | Capital Goods | 0.74% |
| Karur Vysya Bank Ltd. | Financial Services | 0.70% |
| Kaynes Technology India Ltd. | Capital Goods | 0.69% |
| Zomato Ltd. | Consumer Services | 0.69% |
| Maruti Suzuki India Ltd. | Automobile & Auto Components | 0.67% |
| Fortis Healthcare Ltd. | Healthcare | 0.62% |
| Tech Mahindra Ltd. | Information Technology | 0.60% |
| The Indian Hotels Company Ltd. | Consumer Services | 0.57% |
| The Federal Bank Ltd. | Financial Services | 0.57% |
| NTPC Green Energy Ltd. | Power | 0.56% |
| Cipla Ltd. | Healthcare | 0.55% |
| Dabur India Ltd. | Fast Moving Consumer Goods | 0.54% |
| Vijaya Diagnostic Centre Ltd. | Healthcare | 0.51% |
| Eicher Motors Ltd. | Automobile & Auto Components | 0.50% |
| Divi's Laboratories Ltd. | Healthcare | 0.49% |
| Escorts Kubota Ltd. | Capital Goods | 0.49% |
| Indian Bank | Financial Services | 0.48% |
| Ashok Leyland Ltd. | Capital Goods | 0.48% |
| UNO Minda Ltd. | Automobile & Auto Components | 0.48% |
| ICICI Lombard General Insurance Co. Ltd. | Financial Services | 0.47% |
| ABB India Ltd. | Capital Goods | 0.47% |
| Max Healthcare Institute Ltd. | Healthcare | 0.47% |
| Jyoti CNC Automation Ltd. | Capital Goods | 0.44% |
| Kajaria Ceramics Ltd. | Consumer Durables | 0.42% |
| Power Mech Projects Ltd. | Construction | 0.40% |
| Endurance Technologies Ltd. | Automobile & Auto Components | 0.40% |
| Hindalco Industries Ltd. | Metals & Mining | 0.39% |
| SBI Life Insurance Company Ltd. | Financial Services | 0.39% |
| Jindal Steel & Power Ltd. | Metals & Mining | 0.37% |
| Cummins India Ltd. | Capital Goods | 0.36% |
| Whirlpool of India Ltd. | Consumer Durables | 0.35% |
| Netweb Technologies India Ltd. | Information Technology | 0.34% |
| Siemens Ltd. | Capital Goods | 0.34% |
| Vedant Fashions Ltd. | Consumer Services | 0.34% |
| Britannia Industries Ltd. | Fast Moving Consumer Goods | 0.31% |
| Cash & Other Receivables | 3.68% | |
| TREPS_RED_03.02.2025 | 4.76% | |
| Cash & Cash Equivalent | -1.08% | |
| Grand Total | 100.00% |
|
Std.deviation
|
14.09%
|
|
Sharpe
Ratio**
|
0.64
|
|
Beta
|
0.99
|
|
Active
Share
|
49.27%
|
|
Information
Ratio
|
0.47
|
|
Total stocks
in portfolio
|
82
|
|
Top 10 stocks @
|
33.09%
|
|
Net Equity
|
96.31%
|
|
Portfolio Turnover Ratio^
|
Equity 0.40
F&O 0.00 |
| Total Portfolio Turnover Ratio^ |
0.40
|
| **Risk free rate of return (FIMMDA Overnight MIBOR ) 6.65% @ Top 10 Stock also
includes the Future and Options 1. Since the Scheme has not completed 3 years Standard Deviation, Portfolio Beta and Sharpe Ratio is not provided. 2. ^Lower of sales or purchase IDCW by average AUM for last rolling 12 months. 3. Active share is the fraction of a fund's portfolio holdings that deviate from the benchmark index. Source: Bloomberg. 4. Information ratio has been calculated using daily returns over a period of 3 years. |
|
|
Period
|
Scheme - Regular Plan |
Benchmark Nifty 500 TR Index) |
Additional Benchmark (Nifty 50 TR Index) |
|||
|
Returns* |
Value of Rs. 10000 Invested |
Returns* |
Value of Rs. 10000 Invested |
Returns* |
Value of Rs. 10000 Invested |
|
|
1 Year |
15.32% |
11,537 |
10.03% |
11,006 |
9.55% |
10,958 |
|
3 Year |
15.65% |
15,476 |
14.24% |
14,916 |
12.01% |
14,058 |
| 5 Year | 18.44% |
23,327 |
18.16% |
23,054 |
15.80% |
20,844 |
|
Since Inception - Regular Plan |
13.54% |
35,595 |
12.95% |
33,801 |
11.74% |
30,355 |
Past performance may or may not be sustained in future and should not be used as a basis for
comparison with other investments. * CAGR Return.
Notes:
1.Different plans shall have different expense structure. The performance details provided herein are
of Regular Plan of Edelweiss Multi-Cap Fund. Returns are for Growth Option only. Since Inception
returns are calculated on Rs. 10/- invested at inception of the scheme. In case the start/end date is
non business day, the NAV of previous day is used for computation.
2.The scheme is currently managed by Mr. Trideep Bhattacharya (managing this fund from 01-Oct-21. Mr. & Mr. Ashwani Agarwalla (Managing since June 15, 2022). & Mr. Raj Koradia (managing this fund from August 01, 2024). Please Click here for name of the other
schemes currently managed by the Fund
Managers and relevant scheme for performance.
3. Please note that the scheme is acquired from JPMorgan mutual fund on and from the close of business
hours of November 25, 2016, hence disclosure requirement vide SEBI Circular no.
SEBI/HO/IMD/DF3/CIR/P/2018/69 dated April 12, 2018 on performance disclosure post consolidation/
Merger of Schemes, prior to acquisition date, is not provided.
For performance of Direct Plan please
click here
This Product is suitable for investors who are seeking*:
- Long Term Capital Growth
- Investment in equity and equity-related securities of companies across various market capitalisations.
*Investors should consult their financial advisers if in doubt about whether the product is suitable for them.
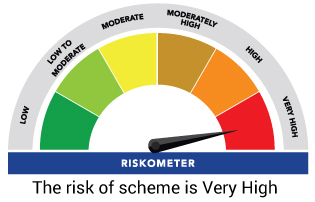
Benchmark Riskometer: Nifty 500 TRI
