
Edelweiss Small Cap Fund
An open ended equity scheme predominantly investing in small cap stocks
Data as on 31st January, 2025
| Investment Objective : The investment objective of the scheme is to generate long term capital appreciation from a portfolio that predominantly invests in equity and equity related securities of small cap companies. However, there can be no assurance that the investment objective of the Scheme will be realised |
|
| Inception Date | 07-Feb-19 |
| Benchmark | Nifty Smallcap 250 TRI |
| Fund Managers Details | Mr. Trideep Bhattacharya Experience 25 years Managing Since 24-Dec-21 Mr. Raj Koradia Experience 7 years Managing Since 01-Aug-24 Mr. Dhruv Bhatia Experience 12 years Managing Since 14-Oct-24 |
| Minimum Investment Amount | Minimum of Rs. 100/‐ and multiples of Re. 1/‐ thereafter. |
| Additional investment amount | Rs.100/‐ and in multiples of Re. 1/‐thereafter. |
| Exit Load |
|
| Total Expense Ratios~: | Regular Plan 1.84% Direct Plan 0.40% |
| Month End AUM |
Rs. 4,173.21 Crore |
| Monthly Average AUM |
Rs. 4,263.91 Crore
|
| Direct Plan IDCW Option |
41.4200
|
| Direct Plan Growth Option |
35.9930
|
| Regular Plan IDCW Option |
45.4940
|
| Regular Plan Growth Option |
39.7990
|
| (as on January 31, 2025) |
|
Name of Instrument
|
Industry
|
% to Net Assets
|
| Equities | 96.82% | |
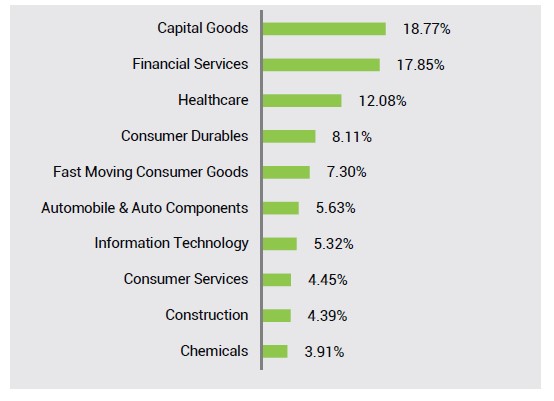
| KEI Industries Ltd. | Capital Goods | 2.68% |
| Karur Vysya Bank Ltd. | Financial Services | 2.62% |
| UNO Minda Ltd. | Automobile & Auto Components | 2.43% |
| Radico Khaitan Ltd. | Fast Moving Consumer Goods | 2.39% |
| Jubilant Ingrevia Ltd. | Chemicals | 2.38% |
| Krishna Inst of Medical Sciences Ltd. | Healthcare | 2.35% |
| Multi Commodity Exchange Of India Ltd. | Financial Services | 2.15% |
| Zensar Technologies Ltd. | Information Technology | 2.11% |
| BSE Ltd. | Financial Services | 2.09% |
| Ajanta Pharma Ltd. | Healthcare | 2.08% |
| JB Chemicals & Pharmaceuticals Ltd. | Healthcare | 1.99% |
| Persistent Systems Ltd. | Information Technology | 1.89% |
| Century Plyboards (India) Ltd. | Consumer Durables | 1.85% |
| Clean Science and Technology Ltd. | Chemicals | 1.80% |
| APL Apollo Tubes Ltd. | Capital Goods | 1.77% |
| The Federal Bank Ltd. | Financial Services | 1.73% |
| Dixon Technologies (India) Ltd. | Consumer Durables | 1.73% |
| Kirloskar Pneumatic Co.Ltd. | Capital Goods | 1.72% |
| Dodla Dairy Ltd. | Fast Moving Consumer Goods | 1.71% |
| Brigade Enterprises Ltd. | Realty | 1.69% |
| Indian Bank | Financial Services | 1.65% |
| Firstsource Solutions Ltd. | Services | 1.63% |
| The Phoenix Mills Ltd. | Realty | 1.53% |
| Cholamandalam Financial Holdings Ltd. | Financial Services | 1.50% |
| Westlife Foodworld Ltd. | Consumer Services | 1.49% |
| K.P.R. Mill Ltd. | Textiles | 1.48% |
| Bikaji Foods International Ltd. | Fast Moving Consumer Goods | 1.46% |
| Voltas Ltd. | Consumer Durables | 1.45% |
| Bharat Dynamics Ltd. | Capital Goods | 1.40% |
| Triveni Turbine Ltd. | Capital Goods | 1.39% |
| City Union Bank Ltd. | Financial Services | 1.39% |
| Birlasoft Ltd. | Information Technology | 1.37% |
| Concord Biotech Ltd. | Healthcare | 1.37% |
| Teamlease Services Ltd. | Services | 1.27% |
| Home First Finance Company India Ltd. | Financial Services | 1.25% |
| Max Financial Services Ltd. | Financial Services | 1.22% |
| Vijaya Diagnostic Centre Ltd. | Healthcare | 1.22% |
| Fortis Healthcare Ltd. | Healthcare | 1.22% |
| V-Mart Retail Ltd. | Consumer Services | 1.19% |
| Arvind Fashions Ltd. | Consumer Services | 1.19% |
| IPCA Laboratories Ltd. | Healthcare | 1.18% |
| JK Lakshmi Cement Ltd. | Construction Materials | 1.12% |
| Ahluwalia Contracts (India) Ltd. | Construction | 1.11% |
| KEC International Ltd. | Construction | 1.07% |
| Emami Ltd. | Fast Moving Consumer Goods | 1.06% |
| Cartrade Tech Ltd. | Consumer Services | 1.04% |
| Vishal Mega Mart Ltd | Consumer Services | 1.01% |
| Avalon Technologies Ltd. | Capital Goods | 0.98% |
| Can Fin Homes Ltd. | Financial Services | 0.97% |
| Metro Brands Ltd. | Consumer Durables | 0.97% |
| Tejas Networks Ltd. | Telecommunication | 0.93% |
| Voltamp Transformers Ltd. | Capital Goods | 0.91% |
| Titagarh Rail Systems Ltd. | Capital Goods | 0.90% |
| Ratnamani Metals & Tubes Ltd. | Capital Goods | 0.87% |
| Garware Technical Fibres Ltd. | Textiles | 0.85% |
| Rategain Travel Technologies Ltd. | Information Technology | 0.84% |
| Vedant Fashions Ltd. | Consumer Services | 0.77% |
| Shree Cement Ltd. | Construction Materials | 0.76% |
| Action Construction Equipment Ltd. | Capital Goods | 0.74% |
| Power Mech Projects Ltd. | Construction | 0.73% |
| Praj Industries Ltd. | Capital Goods | 0.71% |
| Carraro India Ltd. | Automobile & Auto Components | 0.69% |
| KNR Constructions Ltd. | Construction | 0.68% |
| RHI Magnesita India Ltd. | Capital Goods | 0.63% |
| GMM Pfaudler Ltd. | Capital Goods | 0.60% |
| CSB Bank Ltd. | Financial Services | 0.59% |
| Cera Sanitaryware Ltd. | Consumer Durables | 0.59% |
| Mold-Tek Packaging Ltd. | Capital Goods | 0.58% |
| Rolex Rings Ltd. | Automobile & Auto Components | 0.57% |
| Minda Corporation Ltd. | Automobile & Auto Components | 0.56% |
| Carborundum Universal Ltd. | Capital Goods | 0.53% |
| Jamna Auto Industries Ltd. | Automobile & Auto Components | 0.53% |
| NOCIL Ltd. | Chemicals | 0.43% |
| Whirlpool of India Ltd. | Consumer Durables | 0.39% |
| Dalmia Bharat Ltd. | Construction Materials | 0.38% |
| Navin Fluorine International Ltd. | Chemicals | 0.37% |
| Rajratan Global Wire Ltd. | Automobile & Auto Components | 0.18% |
| Gabriel India Ltd. | Automobile & Auto Components | 0.17% |
| Cash & Other Receivables | 3.18% | |
| TREPS_RED_03.02.2025 | 4.23% | |
| Cash & Cash Equivalent | -1.05% | |
| Grand Total | 100.00% |
|
Std.
deviation
|
15.60%
|
|
Sharpe
Ratio**
|
0.79
|
|
Beta
|
0.77
|
|
Active
Share
|
83.16%
|
|
Information
Ratio
|
0.12
|
|
Total stocks
in portfolio
|
78
|
|
Top 10 stocks
|
23.28%
|
|
Net Equity
|
96.80%
|
|
Portfolio Turnover Ratio^
|
Equity 0.18
F&O 0.00 |
| Total Portfolio Turnover Ratio^ |
0.18
|
| 1. ^ Lower of sales or purchase Divided by average AUM for last rolling 12
months. 2. Active share is the fraction of a fund's portfolio holdings that deviate from the benchmark index. Source: Bloomberg. 3. **Risk free rate of return (FIMMDA Overnight MIBOR ) 6.65% 4. @ Top 10 Stock also includes the Future and Options 5. Information ratio has been calculated using daily returns over a period of 3 years. |
|
|
Period
|
Scheme - Regular Plan |
Benchmark (Nifty Smallcap 250 TRI) |
Additional Benchmark (Nifty 50 TR Index) |
|||
|
Returns* |
Value of Rs. 10000 Invested |
Returns* |
Value of Rs. 10000 Invested |
Returns* |
Value of Rs. 10000 Invested |
|
|
1 Year |
11.05% |
11,108 |
5.87% |
10,589 |
9.55% |
10,958 |
| 3 Years | 18.95% |
16,838 |
18.22% |
16,528 |
12.01% |
14,058 |
|
5 Years |
28.09% |
34,531 |
26.01% |
31,814 |
15.80% |
20,844 |
|
Since Inception - Regular Plan |
26.80% |
41,420 |
22.55% |
33,773 |
14.76% |
22,804 |
Past performance may or may not be sustained in future and should not be used as a basis for
comparison with other investments. * CAGR Return.
Notes:
1. Different plans shall have different expense structure.
2.The scheme is currently managed by Trideep Bhattacharya (managing this fund from December 24, 2021). Mr. Raj Koradia (managing this fund from August 01, 2024). & Mr. Dhruv Bhatia (managing this fund from October 14, 2024). Please Click here for name of the other
schemes currently managed by the Fund Managers and relevant scheme for performance.
For performance of Direct Plan please
click here
This Product is suitable for investors who are seeking*:
- Long Term Capital Appreciation Growth
- Investments predominantly in equity and equity related securities of small cap companies.
*Investors should consult their financial advisers if in doubt about whether
the product is suitable for them.
^The Fund Manager may from time to time include other
equity and equity related securities outside the universe
to achieve optimal portfolio construction
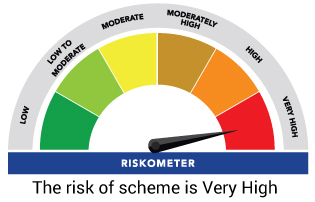
Benchmark Riskometer: Nifty Smallcap 250 TRI
