
Edelweiss Large Cap Fund
An open ended equity scheme predominantly investing in large cap stocks
Data as on 31st January, 2025
| Investment Objective : The investment objective is to seek to generate long-term capital appreciation from a portfolio predominantly consisting equity and equity related securities of the 100 largest corporate by market capitalisation listed in India. However, there is no assurance that the investment objective of the Scheme will be realized and the Scheme does not assure or guarantee any returns. |
|
| Inception Date | 20-May-09 |
| Benchmark | NIFTY 100 TRI |
| Fund Managers Details | Mr. Bharat Lahoti Experience 18 years Managing Since 01-Oct-21 Mr. Bhavesh Jain Experience 16 years Managing Since 02-May-17 |
| Minimum Investment Amount | Rs. 100/- and multiple of Re. 1/- thereafter |
| Additional investment amount | Rs. 100/- per application & in multiples of Re. 1/- thereafter |
| Exit Load |
|
| Total Expense Ratios~: | Regular Plan 2.16% Direct Plan 0.62% |
| Month End AUM |
Rs. 1,109.24 Crore
|
| Monthly Average AUM |
Rs. 1,098.73 Crore
|
| Direct Plan IDCW Option | 79.3300 |
| Direct Plan Growth Option |
27.1000 |
| Regular Plan IDCW Option |
90.4300 |
| Regular Plan Growth Option |
37.7600 |
| (as on January 31, 2025) |
|
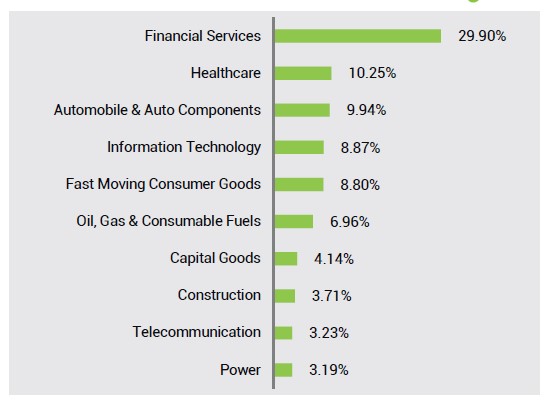
Name of Instrument
|
Industry
|
% to Net
Assets
|
| Equities | 97.22% | |
| ICICI Bank Ltd. | Financial Services | 7.48% |
| HDFC Bank Ltd. | Financial Services | 6.65% |
| Larsen & Toubro Ltd. | Construction | 3.91% |
| Reliance Industries Ltd. | Oil, Gas & Consumable Fuels | 3.84% |
| Bajaj Finance Ltd. | Financial Services | 3.44% |
| Infosys Ltd. | Information Technology | 3.37% |
| Tata Consultancy Services Ltd. | Information Technology | 3.29% |
| ITC Ltd. | Fast Moving Consumer Goods | 3.10% |
| Bharti Airtel Ltd. | Telecommunication | 3.05% |
| Maruti Suzuki India Ltd. | Automobile & Auto Components | 2.73% |
| Axis Bank Ltd. | Financial Services | 2.59% |
| Sun Pharmaceutical Industries Ltd. | Healthcare | 2.59% |
| NTPC Ltd. | Power | 2.51% |
| State Bank of India | Financial Services | 2.25% |
| HCL Technologies Ltd. | Information Technology | 2.14% |
| Kotak Mahindra Bank Ltd. | Financial Services | 2.03% |
| Hero MotoCorp Ltd. | Automobile & Auto Components | 1.80% |
| Ultratech Cement Ltd. | Construction Materials | 1.63% |
| Tata Motors Ltd. | Automobile & Auto Components | 1.33% |
| Cipla Ltd. | Healthcare | 1.28% |
| HDFC Life Insurance Company Ltd. | Financial Services | 1.23% |
| Indus Towers Ltd. | Telecommunication | 1.22% |
| Torrent Pharmaceuticals Ltd. | Healthcare | 1.19% |
| Mahindra & Mahindra Ltd. | Automobile & Auto Components | 1.18% |
| Bajaj Finserv Ltd. | Financial Services | 1.17% |
| Bharat Electronics Ltd. | Capital Goods | 1.14% |
| Colgate Palmolive (India) Ltd. | Fast Moving Consumer Goods | 1.13% |
| Coal India Ltd. | Oil, Gas & Consumable Fuels | 1.11% |
| Lupin Ltd. | Healthcare | 1.00% |
| Apollo Hospitals Enterprise Ltd. | Healthcare | 0.95% |
| Muthoot Finance Ltd. | Financial Services | 0.92% |
| Britannia Industries Ltd. | Fast Moving Consumer Goods | 0.92% |
| Divi's Laboratories Ltd. | Healthcare | 0.88% |
| Unimech Aerospace And Manufacturing Ltd. | Capital Goods | 0.87% |
| Samvardhana Motherson International Ltd. | Automobile & Auto Components | 0.86% |
| Zydus Lifesciences Ltd. | Healthcare | 0.84% |
| Bosch Ltd. | Automobile & Auto Components | 0.82% |
| Cummins India Ltd. | Capital Goods | 0.80% |
| Mankind Pharma Ltd. | Healthcare | 0.79% |
| Pidilite Industries Ltd. | Chemicals | 0.77% |
| United Spirits Ltd. | Fast Moving Consumer Goods | 0.73% |
| P I INDUSTRIES LIMITED | Chemicals | 0.73% |
| Persistent Systems Ltd. | Information Technology | 0.72% |
| KPIT Technologies Ltd. | Information Technology | 0.72% |
| BSE Ltd. | Financial Services | 0.70% |
| HDFC Asset Management Company Ltd. | Financial Services | 0.70% |
| IndusInd Bank Ltd. | Financial Services | 0.69% |
| Power Grid Corporation of India Ltd. | Power | 0.68% |
| Godrej Consumer Products Ltd. | Fast Moving Consumer Goods | 0.65% |
| Hindalco Industries Ltd. | Metals & Mining | 0.64% |
| ICICI Lombard General Insurance Co. Ltd. | Financial Services | 0.62% |
| Tata Steel Ltd. | Metals & Mining | 0.56% |
| Zomato Ltd. | Consumer Services | 0.55% |
| Indian Bank | Financial Services | 0.54% |
| Oracle Financial Services Software Ltd. | Information Technology | 0.54% |
| ICICI Prudential Life Insurance Co Ltd. | Financial Services | 0.51% |
| Hindustan Unilever Ltd. | Fast Moving Consumer Goods | 0.50% |
| FSN E-Commerce Ventures Ltd. | Consumer Services | 0.49% |
| Nippon Life India Asset Management Ltd. | Financial Services | 0.48% |
| Vedanta Ltd. | Metals & Mining | 0.45% |
| Fortis Healthcare Ltd. | Healthcare | 0.43% |
| Trent Ltd. | Consumer Services | 0.41% |
| Bajaj Auto Ltd. | Automobile & Auto Components | 0.40% |
| Oil & Natural Gas Corporation Ltd. | Oil, Gas & Consumable Fuels | 0.40% |
| Abbott India Ltd. | Healthcare | 0.40% |
| Aurobindo Pharma Ltd. | Healthcare | 0.40% |
| Siemens Ltd. | Capital Goods | 0.40% |
| Bajaj Housing Finance Ltd. | Financial Services | 0.38% |
| Kross Ltd. | Automobile & Auto Components | 0.35% |
| P N Gadgil Jewellers Ltd. | Consumer Durables | 0.30% |
| Kesoram Industries Ltd. | Construction Materials | 0.14% |
| ITC Hotels Ltd. | Consumer Services | 0.11% |
| AU Small Finance Bank Ltd. | Financial Services | 0.06% |
| National Stock Exchange of India Ltd. | Financial Services | 0.04% |
| Cash & Other Receivables | 2.15% | |
| TREPS_RED_03.02.2025 | 5.30% | |
| Cash & Cash Equivalent | -3.15% | |
| Debt | 0.63% | |
| Government of India | SOV | 0.63% |
| Grand Total | 100.00% |
|
Std.deviation
|
12.52%
|
|
Sharpe
Ratio**
|
0.55
|
|
Beta
|
0.92
|
|
Active Share
|
33.87%
|
|
Total stocks
in portfolio
|
73
|
|
Information Ratio
|
0.48
|
|
Top 10 stocks @
|
40.86%
|
|
Net Equity
|
99.48%
|
|
Portfolio Turnover Ratio^
|
Equity 0.77
F&O 0.30 |
| Total Portfolio Turnover Ratio^ |
1.07
|
| **Risk free rate of return (FIMMDA Overnight MIBOR) 6.65% @ Top 10 Stock also
includes the Future and Options
1. ^ Lower of sales or purchase IDCW by average AUM for last rolling 12 months. 2. Active share is the fraction of a fund's portfolio holdings that deviate from the benchmark index. Source: Bloomberg. 3. Standard deviation and Sharpe ratio are annualized. 4. Information ratio has been calculated using daily returns over a period of 3 years. |
|
|
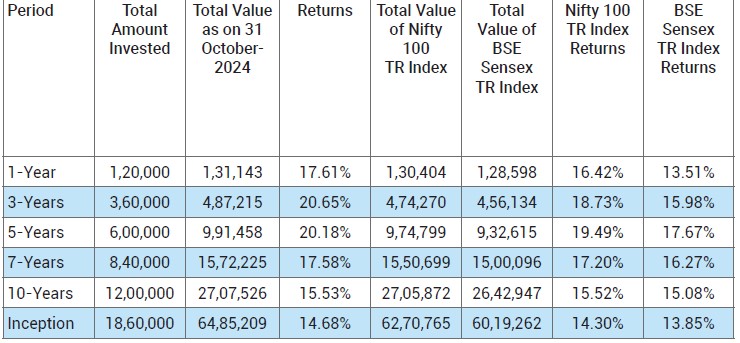
Period
|
Scheme - Regular Plan |
Benchmark (Nifty 100 TRI**) |
Additional Benchmark (S&P BSE Sensex TR Index) |
|||
|
Returns* |
Value of Rs. 10000 Invested |
Returns* |
Value of Rs. 10000 Invested |
Returns* |
Value of Rs. 10000 Invested |
|
|
1 Year |
10.92% |
11,095 |
10.30% |
11,033 |
9.32% |
10,934 |
|
3 Year |
13.48% |
14,620 |
12.34% |
14,180 |
11.55% |
13,883 |
| 5 Year | 15.81% |
20,849 |
16.02% |
21,040 |
15.11% |
20,223 |
|
10 Year |
11.78% |
30,488 |
11.92% |
30,882 |
11.64% |
30,122 |
|
Since Inception - Regular Plan |
14.09% |
79,330 |
13.33% |
71,479 |
13.01% |
68,284 |
Past performance may or may not be sustained in future and should not be used as a basis for
comparison with other investments. * CAGR Return.
Notes:
1.**The Benchmark Index of Edelweiss Large Cap Fund has been changed to NIFTY 100 TRI with effect from
December 1, 2021 in line with the framework issued by AMFI for Tier 1 benchmarks:
2. Different plans shall have different expense structure. The performance details provided herein are
of Regular Plan of Large Cap Fund. In case
the start/end date is non business day, the NAV of previous day is used for computation.
3. The scheme is currently managed by Mr. Bharat Lahoti Experience 18 years (Managing this fund from
01-Oct-21) & The scheme is currently managed by Mr. Bhavesh Jain Experience 16 years (Managing
Since 02-May-17) Please Click here for name of the
other schemes currently managed by the Fund Managers and relevant scheme for performance.
4. $ With effect from June 1, 2024, S&P BSE Sensex TR Index has been renamed to BSE Sensex TR Index.
For performance of Direct Plan please
click here
This Product is suitable for investors who are seeking*:
- To create wealth in the long term
- Investment predominantly in equity and equity related securities including equity derivatives of the 100 largest companies by market capitalization, listed in India.
*Investors should consult their financial advisers if in doubt about whether the product is suitable for them.
Benchmark Riskometer: Nifty 100 TR Index**
