
Edelweiss Equity Savings Fund
An Open ended scheme investing in equity, arbitrage and debt
Data as on 31st January, 2025
| Investment Objective : The investment objective of the scheme is to provide capital appreciation and income distribution to the investors by using equity and equity related instruments, arbitrage opportunities, and investments in debt and money market instruments. However, there can be no assurance that the investment objective of the Scheme will be realized or that income will be generated and the scheme does not assure or guarantee any returns. |
|
| Inception Date | 13-Oct-14 |
| Benchmark | Nifty Equity Savings Index |
| Fund Managers Details | Equity Portion : Debt Portion : |
| Minimum Investment Amount | Rs. 100/- per application and in multiples of Re. 1/- thereafter |
| Additional investment amount | Rs. 100/- per application and in multiples of Re. 1/- thereafter |
| Exit Load |
|
| Total Expense Ratios~: | Regular Plan 1.60% Direct Plan 0.60% |
| Month End AUM |
Rs. 573.03 Crore
|
| Monthly Average AUM |
Rs. 563.22 Crore
|
|
Regular Plan Growth Option
|
23.9980 |
|
Regular Plan IDCW Option
|
16.5860 |
|
Regular Plan Monthly IDCW
Option
|
14.1551 |
|
Direct Plan Growth Option
|
26.3682 |
|
Direct Plan IDCW Option
|
19.1675 |
|
Direct Plan Monthly IDCW Option
|
15.9018 |
| (as on January 31, 2025) |
|
Name of Instrument
|
Industry
|
% to Net Assets
|
| Equities | 27.52% | |
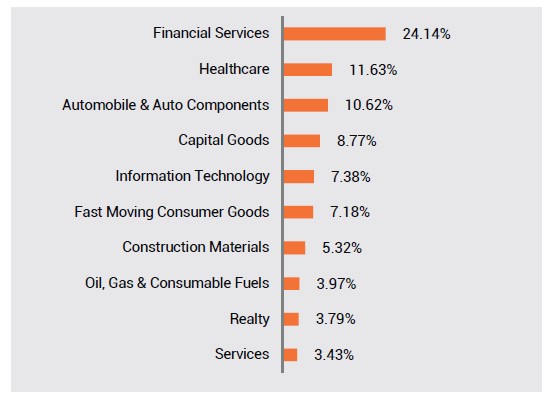
| HDFC Bank Ltd. | Financial Services | 1.60% |
| ICICI Bank Ltd. | Financial Services | 1.60% |
| Reliance Industries Ltd. | Oil, Gas & Consumable Fuels | 1.14% |
| Bajaj Finance Ltd. | Financial Services | 1.05% |
| Sun Pharmaceutical Industries Ltd. | Healthcare | 0.86% |
| Tata Consultancy Services Ltd. | Information Technology | 0.84% |
| Larsen & Toubro Ltd. | Construction | 0.84% |
| NTPC Ltd. | Power | 0.83% |
| Infosys Ltd. | Information Technology | 0.82% |
| State Bank of India | Financial Services | 0.73% |
| Trent Ltd. | Consumer Services | 0.72% |
| HCL Technologies Ltd. | Information Technology | 0.71% |
| The India Cements Ltd. | Construction Materials | 0.68% |
| Bharti Airtel Ltd. | Telecommunication | 0.55% |
| International Gemmological Inst Ind Ltd. | Services | 0.53% |
| Onesource Specialty Pharma Ltd. | Healthcare | 0.48% |
| Premier Energies Ltd. | Capital Goods | 0.48% |
| DAM Capital Advisors Ltd. | Financial Services | 0.48% |
| Sanathan Textiles Ltd. | Textiles | 0.47% |
| Apollo Hospitals Enterprise Ltd. | Healthcare | 0.47% |
| TVS Motor Company Ltd. | Automobile & Auto Components | 0.41% |
| Hindustan Unilever Ltd. | Fast Moving Consumer Goods | 0.38% |
| Marico Ltd. | Fast Moving Consumer Goods | 0.38% |
| ITC Ltd. | Fast Moving Consumer Goods | 0.36% |
| Kotak Mahindra Bank Ltd. | Financial Services | 0.36% |
| Maruti Suzuki India Ltd. | Automobile & Auto Components | 0.35% |
| Tata Motors Ltd. | Automobile & Auto Components | 0.33% |
| Bharat Electronics Ltd. | Capital Goods | 0.31% |
| Persistent Systems Ltd. | Information Technology | 0.31% |
| Colgate Palmolive (India) Ltd. | Fast Moving Consumer Goods | 0.31% |
| Bosch Ltd. | Automobile & Auto Components | 0.30% |
| Axis Bank Ltd. | Financial Services | 0.29% |
| Indian Bank | Financial Services | 0.29% |
| Pidilite Industries Ltd. | Chemicals | 0.28% |
| Go Digit General Insurance Ltd. | Financial Services | 0.26% |
| Torrent Pharmaceuticals Ltd. | Healthcare | 0.24% |
| Kesoram Industries Ltd. | Construction Materials | 0.24% |
| Power Finance Corporation Ltd. | Financial Services | 0.24% |
| Mankind Pharma Ltd. | Healthcare | 0.23% |
| Punjab National Bank | Financial Services | 0.23% |
| Hitachi Energy India Ltd. | Capital Goods | 0.22% |
| AU Small Finance Bank Ltd. | Financial Services | 0.22% |
| Lupin Ltd. | Healthcare | 0.22% |
| Aadhar Housing Finance Ltd. | Financial Services | 0.21% |
| Page Industries Ltd. | Textiles | 0.21% |
| HDFC Life Insurance Company Ltd. | Financial Services | 0.21% |
| Bajaj Finserv Ltd. | Financial Services | 0.20% |
| Muthoot Finance Ltd. | Financial Services | 0.20% |
| Minda Corporation Ltd. | Automobile & Auto Components | 0.20% |
| AWFIS Space Solutions Ltd. | Services | 0.19% |
| Gabriel India Ltd. | Automobile & Auto Components | 0.19% |
| Brookfield India Real Estate Trust | Realty | 0.19% |
| Dixon Technologies (India) Ltd. | Consumer Durables | 0.18% |
| Oil India Ltd. | Oil, Gas & Consumable Fuels | 0.18% |
| TBO Tek Ltd. | Consumer Services | 0.18% |
| Abbott India Ltd. | Healthcare | 0.18% |
| Stylam Industries Ltd. | Consumer Durables | 0.18% |
| Cholamandalam Investment & Fin Co Ltd. | Financial Services | 0.17% |
| Cummins India Ltd. | Capital Goods | 0.17% |
| Aster DM Healthcare Ltd. | Healthcare | 0.17% |
| KPIT Technologies Ltd. | Information Technology | 0.17% |
| GE Vernova T&D India Limited | Capital Goods | 0.15% |
| ICICI Lombard General Insurance Co. Ltd. | Financial Services | 0.15% |
| Brigade Enterprises Ltd. | Realty | 0.15% |
| ECOS (India) Mobility & Hospitality Ltd. | Services | 0.15% |
| Cholamandalam Financial Holdings Ltd. | Financial Services | 0.14% |
| CCL Products (India) Ltd. | Fast Moving Consumer Goods | 0.14% |
| HDFC Asset Management Company Ltd. | Financial Services | 0.14% |
| VARUN BEVERAGES LIMITED | Fast Moving Consumer Goods | 0.13% |
| Nippon Life India Asset Management Ltd. | Financial Services | 0.12% |
| Voltas Ltd. | Consumer Durables | 0.10% |
| Mindspace Business Parks Reit | Realty | 0.08% |
| ITC Hotels Ltd. | Consumer Services | 0.01% |
| Ceigall India Ltd. | Construction | 0.01% |
| GMR Airports Ltd. | Services | 0.00% |
| JSW Steel Ltd. | Metals & Mining | 0.00% |
| GAIL (India) Ltd. | Oil, Gas & Consumable Fuels | 0.00% |
| REC Ltd. | Financial Services | 0.00% |
| Adani Ports & Special Economic Zone Ltd. | Services | 0.00% |
| Biocon Ltd. | Healthcare | 0.00% |
| Bank of Baroda | Financial Services | 0.00% |
| IndusInd Bank Ltd. | Financial Services | 0.00% |
| ICICI Prudential Life Insurance Co Ltd. | Financial Services | 0.00% |
| Vedanta Ltd. | Metals & Mining | 0.00% |
| UPL Ltd. | Chemicals | 0.00% |
| Multi Commodity Exchange Of India Ltd. | Financial Services | 0.00% |
| Vodafone Idea Ltd. | Telecommunication | 0.00% |
| Aditya Birla Fashion and Retail Ltd. | Consumer Services | 0.00% |
| Oil & Natural Gas Corporation Ltd. | Oil, Gas & Consumable Fuels | 0.00% |
| Hindalco Industries Ltd. | Metals & Mining | 0.00% |
| Coal India Ltd. | Oil, Gas & Consumable Fuels | 0.00% |
| Tata Power Company Ltd. | Power | 0.00% |
| Hindustan Aeronautics Ltd. | Capital Goods | 0.00% |
| Polycab India Ltd. | Capital Goods | 0.00% |
| Bharat Petroleum Corporation Ltd. | Oil, Gas & Consumable Fuels | 0.00% |
| Bharat Forge Ltd. | Automobile & Auto Components | 0.00% |
| The Federal Bank Ltd. | Financial Services | 0.00% |
| The Indian Hotels Company Ltd. | Consumer Services | 0.00% |
| DLF Ltd. | Realty | 0.00% |
| Adani Enterprises Ltd. | Metals & Mining | 0.00% |
| Hero MotoCorp Ltd. | Automobile & Auto Components | 0.00% |
| Manappuram Finance Ltd. | Financial Services | 0.00% |
| Glenmark Pharmaceuticals Ltd. | Healthcare | 0.00% |
| Bharat Heavy Electricals Ltd. | Capital Goods | 0.00% |
| Zomato Ltd. | Consumer Services | 0.00% |
| Ambuja Cements Ltd. | Construction Materials | 0.00% |
| Godrej Properties Ltd. | Realty | 0.00% |
| NMDC Ltd. | Metals & Mining | 0.00% |
| Asian Paints Ltd. | Consumer Durables | 0.00% |
| Grasim Industries Ltd. | Construction Materials | 0.00% |
| Siemens Ltd. | Capital Goods | 0.00% |
| Aurobindo Pharma Ltd. | Healthcare | 0.00% |
| Debt | 21.88% | |
| Punjab National Bank | Financial Services | 8.66% |
| Government of India | SOV | 6.27% |
| HDB Financial Services Ltd. | Financial Services | 4.34% |
| National Bk for Agriculture & Rural Dev. | Financial Services | 1.74% |
| National Housing Bank | Financial Services | 0.87% |
| Edelweiss Mutual Fund | Mutual Fund | 0.00% |
| Cash & Other Receivables | 10.74% | |
| TREPS_RED_03.02.2025 | 9.10% | |
| Cash & Cash Equivalent | 1.64% | |
| Grand Total | 60.14% |
|
Yield to
maturity (YTM)
#
|
7.12%
|
|
Modified
Duration
#
|
1.53 years
|
|
Average
Maturity
#
|
1.99 years
|
|
Macaulay
Duration #
|
1.60 years
|
|
Std.deviation
|
4.09%
|
|
Sharpe
Ratio**
|
0.67
|
|
Beta
|
0.79
|
|
Active Share |
51.95%
|
|
Total stocks
in portfolio
|
73
|
|
Top 10 stocks
|
10.31%
|
|
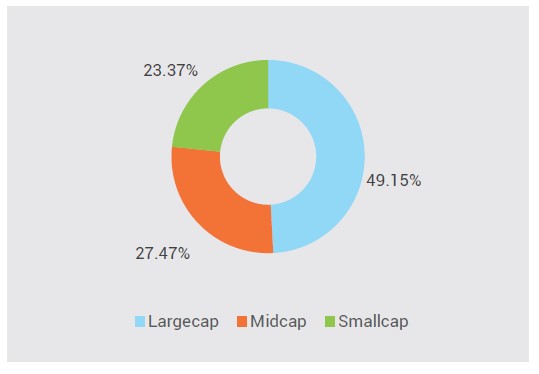
Net Equity
|
27.75%
|
Information Ratio |
0.26 |
Portfolio Turnover Ratio^ |
Equity
0.93 F&O 5.12 Debt 0.28 |
|
Total
Portfolio
Turnover
Ratio^
|
6.33
|
| # Yield to maturity (YTM), Modified Duration, Average Maturity and Macaulay Duration
for Debt Portion. **Risk free rate of return (FIMMDA Overnight MIBOR) 6.65% 1. Active share is the fraction of a fund's portfolio holdings that deviate from the benchmark index. Source: Bloomberg. 2. Standard deviation and Sharpe ratio are annualized. 3. ^ Lower of sales or purchase divided by average AUM for last rolling 12 months. 4. Information ratio has been calculated using monthly returns over a period of 3 years. |
|
|
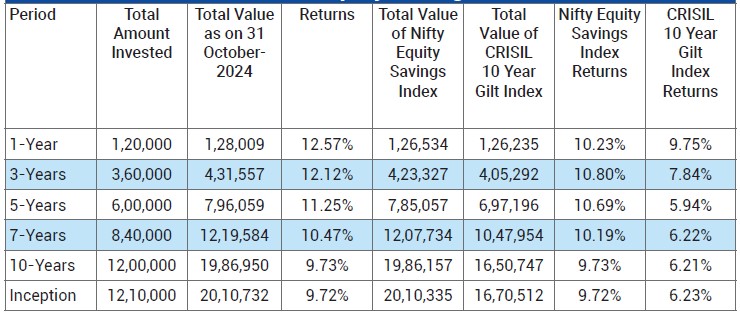
Period
|
Scheme - Regular Plan |
Benchmark |
Additional Benchmark (CRISIL 10 year Gilt Index) |
|||
|
Returns* |
Value of Rs. 10000 Invested |
Returns* |
Value of Rs. 10000 Invested |
Returns* |
Value of Rs. 10000 Invested |
|
|
1 Year |
10.90% |
11,093 |
8.63% |
10,866 |
9.77% |
10,980 |
|
3 Year |
9.37% |
13,086 |
8.70% |
12,846 |
6.62% |
12,121 |
| 5 Year | 10.35% |
16,369 |
9.89% |
16,034 |
5.77% |
13,244 |
|
10 Year |
8.50% |
22,629 |
8.62% |
22,892 |
6.55% |
18,868 |
|
Since Inception - Regular Plan |
8.86% |
23,998 |
8.98% |
24,269 |
7.08% |
20,234 |
Past performance may or may not be sustained in future and should not be used as a basis for
comparison with other investments. * CAGR Return.
Notes:
1. Different plans shall have different expense structure. The performance details provided herein are of Regular Plan of Edelweiss Equity Savings Fund. Returns are for Growth Option only. Since Inception returns are calculated on Rs. 10/- invested at inception of the scheme. In case the start/end date is non business day, the NAV of previous day is used for computation.
2. The scheme is currently managed by Mr. Bharat Lahoti (managing this fund from September 18, 2017), Mr. Bhavesh Jain (Managing this fund from October 01, 2021) & Mr. Rahul Dedhia (Managing this
fund from July 01, 2024). & Ms. Pranavi Kulkarni (managing this fund from August 01, 2024). Please Click here for name of the other schemes
currently managed by the Fund Managers and relevant scheme for performance.
3. Please note that Edelweiss Equity Savings Advantage Fund was merged with JP Morgan India Equity
Income Fund and feature of JP Morgan India Equity Income Fund was retained with surviving
scheme name as Edelweiss Equity Savings Advantage Fund. Further, performance details as per SEBI
Circular dated April 12, 2018 of JP Morgan schemes prior to acquisition data is not provided.
4. #Please note that benchmark of the Scheme is changed from 70% Crisil Liquid Fund Index + 30% Nifty
50 Index to Nifty Equity Savings Index.
For performance of Direct Plan please
click here
This Product is suitable for investors who are seeking*:
- Income distribution by investing in debt and money
market instrument and arbitrage opportunities.
- Long term capital appreciation by using equity and equity related instruments.
*Investors should consult their financial advisers if in doubt about whether the product is suitable for them.
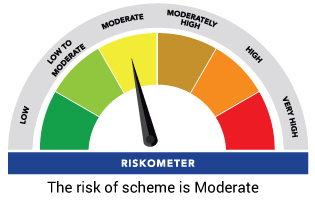
Benchmark Riskometer: Nifty Equity Savings Index
