
Edelweiss Aggressive Hybrid
Fund
An open ended hybrid scheme investing predominantly in equity and equity related instruments
Data as on 31st January, 2025
| Investment Objective : The investment objective of the scheme is to generate long term growth of capital and current income through a portfolio investing predominantly in equity and equity related instruments and the balance in debt and money market securities. However, there is no assurance that the investment objective of the Scheme will be reaIized and the Scheme does not assure or guarantee any returns. |
|
| Inception Date | 12-Aug-09 |
| Benchmark | CRISIL Hybrid 35+65 - Aggressive Index |
| Fund Managers Details | Equity Portion Debt Portion: |
| Minimum Investment Amount | Rs. 100/- per application & in multiples of Re. 1/- thereafter |
| Additional investment amount | Rs. 100/- per application & in multiples of Re. 1/- thereafter |
| Exit Load |
|
| Total Expense Ratios~: | Regular Plan 1.95% Direct Plan 0.36% |
| Month End AUM |
Rs. 2,356.19 Crore
|
| Monthly Average AUM |
Rs. 2,357.51 Crore
|
| Regular Plan Growth Option | 59.3800 |
| Regular Plan IDCW Option | 27.0400 |
| Direct Plan Growth Option | 67.9000 |
| Direct Plan IDCW Option | 32.7000 |
| (as on January 31, 2025) |
|
Name of Instrument
|
Industry
|
% to Net Assets
|
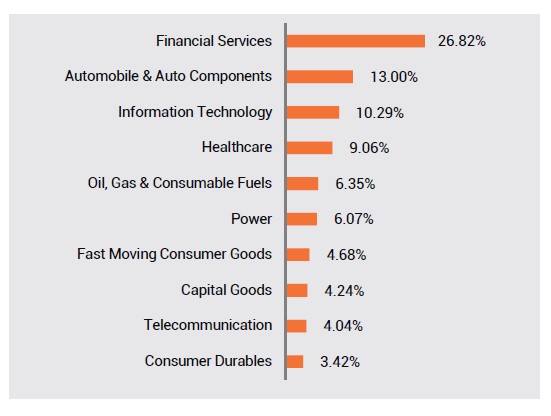
| Equities | 71.97% | |
| ICICI Bank Ltd. | Financial Services | 6.17% |
| HDFC Bank Ltd. | Financial Services | 4.19% |
| Bharti Airtel Ltd. | Telecommunication | 2.70% |
| Sun Pharmaceutical Industries Ltd. | Healthcare | 2.37% |
| NTPC Ltd. | Power | 2.34% |
| Reliance Industries Ltd. | Oil, Gas & Consumable Fuels | 2.00% |
| HCL Technologies Ltd. | Information Technology | 1.87% |
| Infosys Ltd. | Information Technology | 1.80% |
| Larsen & Toubro Ltd. | Construction | 1.58% |
| Maruti Suzuki India Ltd. | Automobile & Auto Components | 1.54% |
| ITC Ltd. | Fast Moving Consumer Goods | 1.45% |
| Axis Bank Ltd. | Financial Services | 1.40% |
| Tata Consultancy Services Ltd. | Information Technology | 1.33% |
| Mankind Pharma Ltd. | Healthcare | 1.32% |
| Oil & Natural Gas Corporation Ltd. | Oil, Gas & Consumable Fuels | 1.12% |
| Apollo Hospitals Enterprise Ltd. | Healthcare | 1.05% |
| State Bank of India | Financial Services | 1.04% |
| Bajaj Finserv Ltd. | Financial Services | 1.01% |
| Eicher Motors Ltd. | Automobile & Auto Components | 0.97% |
| Lupin Ltd. | Healthcare | 0.93% |
| Bajaj Finance Ltd. | Financial Services | 0.91% |
| Inventurus Knowledge Solutions Ltd. | Information Technology | 0.89% |
| PB Fintech Ltd. | Financial Services | 0.89% |
| TVS Motor Company Ltd. | Automobile & Auto Components | 0.86% |
| BSE Ltd. | Financial Services | 0.82% |
| Godrej Properties Ltd. | Realty | 0.82% |
| Persistent Systems Ltd. | Information Technology | 0.81% |
| Dixon Technologies (India) Ltd. | Consumer Durables | 0.81% |
| Granules India Ltd. | Healthcare | 0.79% |
| Nippon Life India Asset Management Ltd. | Financial Services | 0.79% |
| HDFC Life Insurance Company Ltd. | Financial Services | 0.78% |
| Kotak Mahindra Bank Ltd. | Financial Services | 0.77% |
| Hero MotoCorp Ltd. | Automobile & Auto Components | 0.75% |
| InterGlobe Aviation Ltd. | Services | 0.74% |
| Avenue Supermarts Ltd. | Consumer Services | 0.72% |
| Zydus Lifesciences Ltd. | Healthcare | 0.71% |
| Britannia Industries Ltd. | Fast Moving Consumer Goods | 0.70% |
| Minda Corporation Ltd. | Automobile & Auto Components | 0.69% |
| Bharat Electronics Ltd. | Capital Goods | 0.68% |
| Ultratech Cement Ltd. | Construction Materials | 0.65% |
| Tata Motors Ltd. | Automobile & Auto Components | 0.65% |
| Divi's Laboratories Ltd. | Healthcare | 0.64% |
| Muthoot Finance Ltd. | Financial Services | 0.63% |
| Bajaj Auto Ltd. | Automobile & Auto Components | 0.62% |
| Coal India Ltd. | Oil, Gas & Consumable Fuels | 0.58% |
| Torrent Pharmaceuticals Ltd. | Healthcare | 0.57% |
| Indraprastha Gas Ltd. | Oil, Gas & Consumable Fuels | 0.56% |
| Hindustan Unilever Ltd. | Fast Moving Consumer Goods | 0.55% |
| Mazagon Dock Shipbuilders Ltd. | Capital Goods | 0.55% |
| Oracle Financial Services Software Ltd. | Information Technology | 0.54% |
| Max Healthcare Institute Ltd. | Healthcare | 0.53% |
| Hitachi Energy India Ltd. | Capital Goods | 0.53% |
| Mahanagar Gas Ltd. | Oil, Gas & Consumable Fuels | 0.53% |
| Cipla Ltd. | Healthcare | 0.52% |
| Indian Bank | Financial Services | 0.52% |
| Fortis Healthcare Ltd. | Healthcare | 0.51% |
| Bharat Petroleum Corporation Ltd. | Oil, Gas & Consumable Fuels | 0.50% |
| Petronet LNG Ltd. | Oil, Gas & Consumable Fuels | 0.50% |
| Dr. Reddy's Laboratories Ltd. | Healthcare | 0.50% |
| Power Grid Corporation of India Ltd. | Power | 0.49% |
| Motilal Oswal Financial Services Ltd. | Financial Services | 0.48% |
| Mahindra & Mahindra Ltd. | Automobile & Auto Components | 0.47% |
| Kaynes Technology India Ltd. | Capital Goods | 0.46% |
| National Aluminium Company Ltd. | Metals & Mining | 0.45% |
| Hindalco Industries Ltd. | Metals & Mining | 0.44% |
| Zomato Ltd. | Consumer Services | 0.40% |
| Bansal Wire Industries Ltd. | Capital Goods | 0.38% |
| Trent Ltd. | Consumer Services | 0.38% |
| Senco Gold Ltd. | Consumer Durables | 0.36% |
| The India Cements Ltd. | Construction Materials | 0.36% |
| Cholamandalam Financial Holdings Ltd. | Financial Services | 0.36% |
| CCL Products (India) Ltd. | Fast Moving Consumer Goods | 0.34% |
| TBO Tek Ltd. | Consumer Services | 0.34% |
| Jyoti CNC Automation Ltd. | Capital Goods | 0.32% |
| AWFIS Space Solutions Ltd. | Services | 0.29% |
| Updater Services Ltd. | Services | 0.29% |
| Craftsman Automation Ltd. | Automobile & Auto Components | 0.28% |
| Swiggy Ltd. | Consumer Services | 0.27% |
| Home First Finance Company India Ltd. | Financial Services | 0.24% |
| Tata Steel Ltd. | Metals & Mining | 0.20% |
| ITC Hotels Ltd. | Consumer Services | 0.05% |
| Kesoram Industries Ltd. | Construction Materials | 0.02% |
| Brookfield India Real Estate Trust | Realty | 0.01% |
| National Stock Exchange of India Ltd. | Financial Services | 0.00% |
| Debt | 21.50% | |
| Punjab National Bank | Financial Services | 6.27% |
| Government of India | SOV | 4.63% |
| National Bk for Agriculture & Rural Dev. | Financial Services | 3.78% |
| HDB Financial Services Ltd. | Financial Services | 3.14% |
| Aditya Birla Housing Finance Ltd. | Financial Services | 1.06% |
| Small Industries Development Bk of India | Financial Services | 1.05% |
| National Housing Bank | Financial Services | 0.84% |
| Edelweiss Mutual Fund | Mutual Fund | 0.73% |
| Cash & Other Receivables | 6.53% | |
| TREPS_RED_03.02.2025 | 5.86% | |
| Cash & Cash Equivalent | 0.67% | |
| Grand Total | 100.00% |
|
Yield to
maturity (YTM)
#
|
7.24%
|
|
Modified
Duration
#
|
1.43
years
|
|
Average
Maturity
#
|
1.72
years
|
|
Macaulay
Duration #
|
1.50 years
|
|
Std. deviation
|
9.90%
|
|
Sharpe
Ratio**
|
0.88
|
|
Beta
|
1.03
|
|
Active Share
|
46.28%
|
|
Total stocks
in portfolio
|
82
|
|
Top 10 stocks @
|
26.56%
|
|
Net Equity
|
75.25%
|
|
Portfolio Turnover Ratio^
|
Equity 0.79
F&O 0.22 Debt 0.30 |
| Total Portfolio Turnover Ratio^ |
1.31
|
|
Information Ratio
|
1.48
|
| # Yield to maturity (YTM), Modified Duration, Average Maturity and Macaulay Duration
for Debt Portion. @ Top 10 Stock also includes the Future and Options **Risk free rate of return (FIMMDA Overnight MIBOR) 6.65% 1. Standard deviation and Sharpe ratio are annualized. 2. ^Lower of sales or purchase divided by average AUM for last rolling 12 months. 3. Active share is the fraction of a fund's portfolio holdings that deviate from the benchmark index. Source: Bloomberg. 4. Information ratio has been calculated using monthly returns over a period of 3 years. |
|
|
Period
|
Scheme - Regular Plan |
Benchmark CRISIL Hybrid 35+65 - Aggressive Index) |
Additional Benchmark (Nifty 50 TR Index) |
|||
|
Returns* |
Value of Rs. 10000 Invested |
Returns* |
Value of Rs. 10000 Invested |
Returns* |
Value of Rs. 10000 Invested |
|
|
1 Year |
13.69% |
11,373 |
10.01% |
11,004 |
9.55% |
10,958 |
|
3 Year |
15.40% |
15,375 |
11.49% |
13,864 |
12.01% |
14,058 |
|
5 Year |
17.00% |
21,944 |
14.34% |
19,557 |
15.80% |
20,844 |
| 10 Year | 11.64% |
30,112 |
11.33% |
29,276 |
11.66% |
30,174 |
15 Year |
11.91% |
54,179 |
11.55% |
51,586 |
12.38% |
57,736 |
|
Since Inception - Regular Plan |
12.19% |
59,380 |
11.82% |
56,371 |
12.67% |
63,436 |
Past performance may or may not be sustained in future and should not be used as a basis for
comparison with other investments. * CAGR Return.
Notes:
1. Different plans shall have different expense structure. The performance details provided herein are of Regular Plan of Edelweiss Aggressive Hybrid Fund. Returns are for Growth Option only. In case the start/end date is non business day, the NAV of previous day is used for computation.
2. The scheme is currently managed by Bharat Lahoti (managing this fund from October 01, 2021), (managing Bhavesh Jain this fund from October 14, 2015) , Rahul Dedhia (managing this fund from July
01, 2024). & Ms. Pranavi Kulkarni (managing this fund from August 01, 2024). Please Click here
for name of the other schemes currently managed by the Fund Managers and relevant scheme for
performance.
For performance of Direct Plan please
click here
This Product is suitable for investors who are seeking*:
- To create wealth and income in the long term
- Investment in equity and equity-related securities and fixed income instruments
*Investors should consult their financial advisers if in doubt about whether the product is suitable for them.
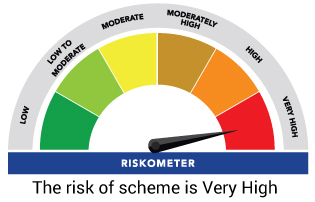
Benchmark Riskometer: CRISIL Hybrid 35+65 - Aggressive Index
